YOUR QUARTERLY VIDEO REVIEW
Hear our thoughts on the previous quarter & your financial life.
Our 2024 Q1 Quarterly Client Update video, sent to our clients to accompany quarterly statements. Please contact your Triune Financial Planner with questions!
Calm over Chaos: Timeless Investing in a World of Uncertainty
Hello to all of our Triune friends and clients! The first quarter is behind us, and spring is in full bloom which means it’s time for another Quarterly Video Update! Today, we will review recent market performance, the “election illusion”, and the value of long-term planning in a world of uncertainty.
The Solar Eclipse:
Many of us were lucky enough to see the total solar eclipse on April 8th earlier this month. For me, it was truly an experience of a lifetime that my vocabulary falls short of explaining. There is just nothing quite like it.
The author Seth Godin posted a fascinating perspective on the eclipse3, and we couldn’t help but draw an analogy for your investing experience. Here’s what Seth said…
“Until just recently, a solar eclipse wasn’t a tourist event. It was the cause of real panic. Two reasons are worth considering:
It was a surprise. They were not predicted.
They were unexplained. No one had any idea what was going on.
Eliminate surprise and explain the circumstances and panic starts to fade.”
Wow – eliminate surprise and explain circumstances and panic starts to fade. In your financial life planning review meetings with your advisor, you have likely had this conversation. Through both bull and bear markets, it’s so important to contextualize performance, increasing your understanding of how the market works so that you can eliminate surprise and explain the circumstances of your portfolio.
So let’s dive in…
Recent Market Performance
The first quarter of 2024 was the strongest Q1 since 2019, posting healthy returns in every major asset class. The US Market Index gained 10.2% during the first quarter1 and stocks have more than made up for their losses during the 2022 bear market.
In this last quarter, value stocks narrowly beat growth stocks. Many of the gains in the value category came from financial services and energy stocks1. As you know, we employ an intentional tilt towards small, value and profitable company stocks in your portfolio. This can be frustrating during periods where growth and large company stocks are outperforming. So let’s look at some historical data on the Value “premium” – the “extra return” you get for investing in value stocks over growth stocks over the long-term.
In the chart below, you’re looking at the 4 quartiles of the Annual Value Premium from 1927 – 2023 in the US Market, arranged from low to high. As you’ll recall, we are using the word “premium” to describe the relative performance of value vs. growth stocks. In the chart just below, you’re seeing each following year’s average Value Premium. For those in the bottom quartile (these are years when value stocks most underperformed growth stocks)… those years were followed by an average annual premium (value outperformed growth) of 4.41%. The top quartile years on the far right of the chart (years where value most outperformed growth) were followed by an average annual premium of 3.5%. Value stocks’ average relative performance versus growth stocks has been positive whether past relative performance was weak or strong. Having consistent exposure to this premium can help you capture long-term returns.

Additional highlights for the quarter were that Big Tech continued to drive market gains, while dividend stocks continue to lag the broader market1. The Fed kept interest rates steady, but there are expectations that the first rate cuts will come in June of this year. Overall, the trailing 1-year returns in the stock market have been quite strong.
With all of this positive movement in the stock market, human nature and the financial media always looks for something on the horizon to feed our doubts and uncertainty… and wouldn’t you know it, the US Presidential election is just months away.
Regardless of political affiliation, it is common to think (and even fear) that the sitting President has an outsized influence on the stock market. So let’s take a look at what we call the “Election Illusion”.
The “Election Illusion” & Long-Term Planning
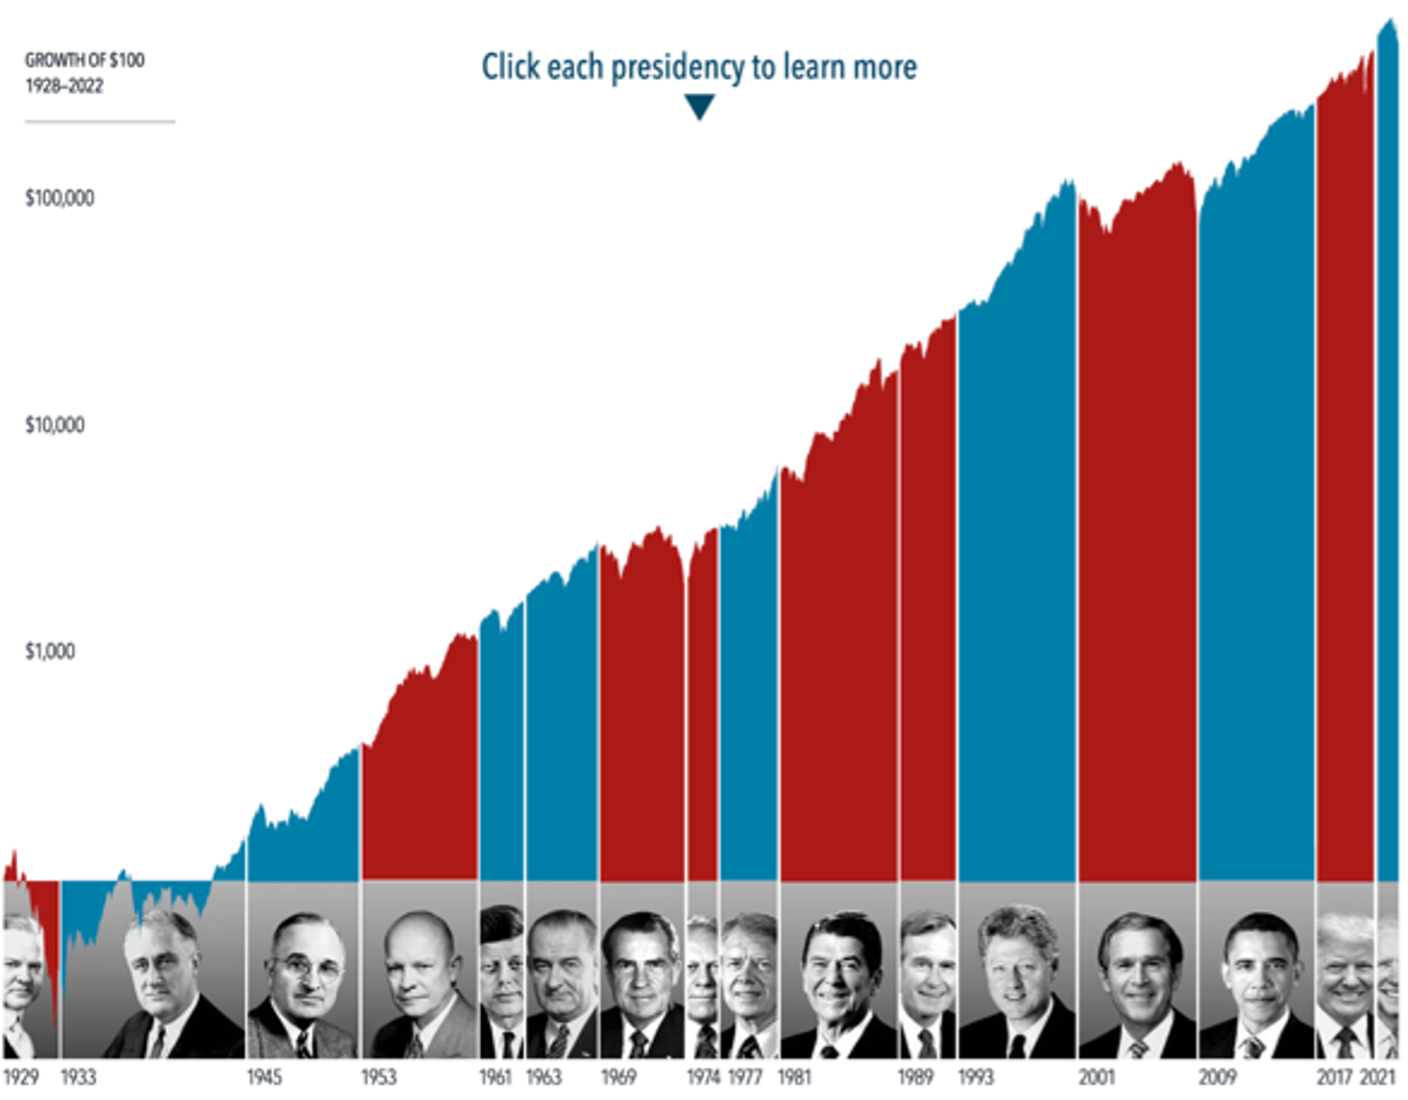
The anticipation building up to elections often brings with it questions about how financial markets will respond. But the outcome of an election is only one of many inputs to the market2.
In looking at the last nearly 100 years of presidential terms, you can see a consistent upward march for US equities regardless of the administration in place. This is consistent with the historical reality that annual stock market returns are positive 70% of the time.
You might see this and think, “Ok, but what about the short-term fluctuations that can happen as the election heats up? Is there a strategy to avoid losses during that time?”
Unfortunately, if there is a strategy, it wouldn’t be a reliable one. So let’s look at monthly returns going back to July 1927. This chart shows a broad-market US index with each horizontal dash representing a month, arranged from left to right by market return in 1% increments. Most election months have not produced extreme returns, positive or negative.
The winning party has not been a reliable predictor for the direction or magnitude of market movements in election months, either.

Our take? Presidential election cycles offer no predictability, and the history of market behavior makes a strong case for sticking with your long-term investing plan.
But what about timing the market… you know, pulling your money out of stocks while you “wait for things to calm down”? After all, that is Rule #1 in investing – buy low and sell high.
The Fallacy of Market Timing
There will always be a temptation to “time the market”. To get out before it gets bad, and get back in before it gets good. But there are several problems with this approach, not the least of which is that you have to be right TWICE (when you exit, and when you re-enter the market).
So let’s look at a simple representation of trying to time the market:

This chart shows the impact of missing the best consecutive days in the stock market spanning the 25-year period from 1999 through 2023.
If you invested $1,000 in the Russell 3000 Index in 1999, your investment would be worth nearly 6.5 times that today, accumulating to a whopping $6,449.
If you were invested the entire time, but missed out on the best week… that cost you over $1,000 in growth. Miss the best month? There goes 20% of the total return you could have had. Of course, the longer the period of strong performance you miss, the worse your total return.
But HERE is the interesting part… look at the dates of the best week, month, 3 months, and 6 months. Notice anything?
All of these occurred during extremely volatile periods in the market. During times when uncertainty was at an all-time high!
The BEST week in the last 25 years… was in the fall of 2008… when investor confidence was at an all time low, and the appeal to “get out now” was stronger than ever. But you can plainly see the large impact this kind of market timing can have on your total return. The problem is that our human nature does not align with Rule #1 – because we often don’t have the guts to buy, get back in the market, when things look grim.
This is exactly why we often discuss your investment goals in terms of time horizons, or our “Three Bucket Approach”… having a sound investment philosophy allows you to weather the storm in the short-term, and in exchange… achieve better performance in your investment portfolio in the long-term.
Tying It All Together
So might this year’s election results be a surprise? Or feel unexplainable? Sure… but that’s politics. Just like a solar eclipse 1,000 years ago. Full of surprise and mystery.
But investing… investing is more predictable in the long-term, and we can work to understand the circumstances that drive positive returns, and then use them to our benefit. Which is exactly the evidence-based, long-term approach we use in constructing your Triune portfolios.
As always, your unique Financial Life Plan should guide your investment decisions. If your goals inform your plans, and your plans inform your investments, we believe you’ll consistently achieve a favorable investment experience. It’s an honor to work together, and your Triune advisor team stands ready to any questions you may have. We look forward to our next conversation.
Thank you.
Sources:
1 https://www.morningstar.com/markets/13-charts-q1-stock-rally-that-just-wouldnt-quit
2 https://my.dimensional.com/how-much-impact-does-the-president-have-on-stocks
3 https://seths.blog/2024/04/surprise-and-uncertainty/
Disclosures: Financial advisors are responsible for evaluating investment risks independently and for exercising independent judgment in determining whether investments are appropriate for their clients. Member SIPC. Past performance is no guarantee of future results. Diversification neither assures a profit nor guarantees against loss in a declining market. Investing involves risks including potential loss of principal and fluctuating value. All expressions of opinion are subject to change without notice in reaction to shifting market conditions. This content is provided for informational purposes, and it is not to be construed as an offer, solicitation, recommendation or endorsement of any particular security, products, or services. Triune Financial Partners, LLC is an investment advisor registered with the Securities and Exchange Commission.